High Shear Wet Granulation
October 18, 2021 2021-12-17 10:09High Shear Wet Granulation
Determining the endpoint and scaling factors in High Shear Wet Granulation (HSWG)
Observing granulation after addition a small amount of water to a sugar powder (Video)
LIR technology is specifically suited to closely monitor granulation processes since FPM and PCF process signatures effectively separate small and large particles and characterize the uniformity of the mixture. The video shows a real-time measurement of granulation of common sugar. In this test, after observing a signal for dry powder, several droplets of water (6 ml) are added to a 1.5 liters of sugar powder being processed in a laboratory mixer. The process signature then clearly shows events of agglomeration and formation of dense granules within the powder volume, and the increased granule content with time. The video illustrates the application of Lenterra Inline Rheometer to monitoring HSWG and determination of granulation end-point.
Monitoring an HSWG process using LIR
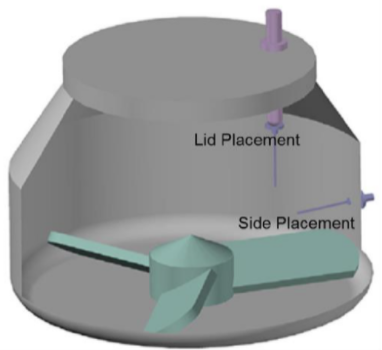
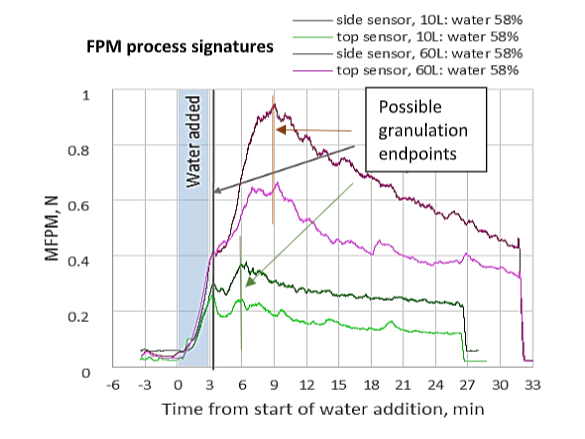
Monitoring granulation of high drug load formulations of Brivanib Alaninate using a LIR-DD configuration where two DFF sensors were installed in different positions inside two GEA PharmaConnect® granulators (10 and 60L) revealed several important findings:
- The critical points of granulation evolution recorded by LIR technology (such as maxima and inflection points on the plots) are independent of the sensor position inside the bowl.
- The FPM process signatures for both 10L and 60L granulators display a peak that is noticeably delayed from the end of water addition. This feature was found unique for the 58% w/w formulation. Measurements conducted for water 48%i and 67% formulation did not reveal such a delayed peak, therefore, the LIR was able to optimize a critical process parameter (CPP) for Brivanib granulation.
- The presence of peaks on the FPM signatures may indicate the culmination of dominance of granulation growth and consolidation mechanisms over attrition and breakage in the powder state. Therefore, this peak on the FPM signature may serve as an indicator of desirable ranges of wet massing times that may be acceptable as an end point of the granulation.
- The similarity in the FPM signatures and the timing of the peaks can be utilized to derive parameters that can assist scale up of granulation.
Process Fingerprint for Granulation of Brivanib Alaninate in 10L GEA PharmaConnect® Granulator
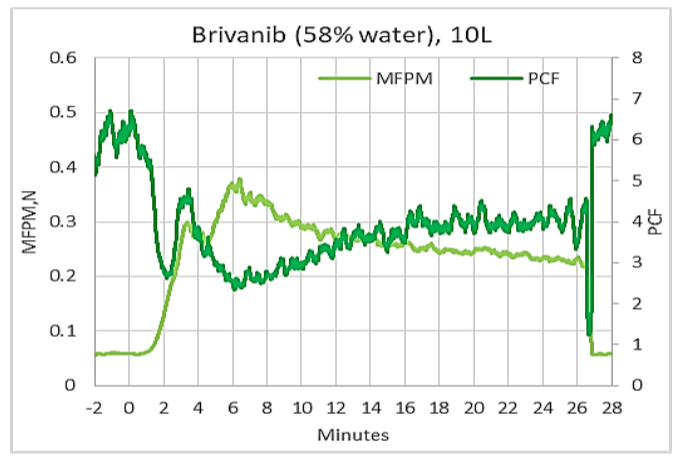
In addition to FPM process signature, LIR outputs PCF signature. Two of them combined form the process fingerprint. Such a fingerprint for one of the measurement discussed above can be seen on the figure. PCF (dark green) is the measure of powder uniformity or cohesiveness of the mixture. Higher PCF indicates more uniform distribution of granules and low PCF tells that granules of many different sizes are present in the mixture. PCF signature display a minimum approximately where FPM signature shows a peak, therefore in this example of Brivanib granulation, in 10L granulator, at a time of 6 minute after water addition, the wet mass in the granulator contained largest number of agglomerates along with a significant portion of smaller granules. This notion confirms that this is most probably the best time to stop granulation process.
Details of the study are available in White Paper 9, in a paper in Journal Pharmaceutical Science and in the Handbook of Pharmaceutical HSWG (link to the handbook on our site – the pdf is not available)
FPM granulation process signature is similar to at-line measurements by FT-4 Powder Rheometer®
Lenterra Inline Rheometer relies on the measurement of the flow force, so do off-line rheometers such as FT-4 Powder Rheometer® that provides dynamic powder testing by measuring the axial and rotational forces acting on a blade as it rotates through a powder sample. FT-4’s key baseline metric is Basic Flowability Energy (BFE). Studies investigating the value of dynamic testing in the preparation of optimized tableting blends by HSWG show a direct correlation between the BFE of granules (wet and dried) and the hardness of tablets manufactured from them. This highlights the value of bulk powder force measurements for granulation monitoring and control.
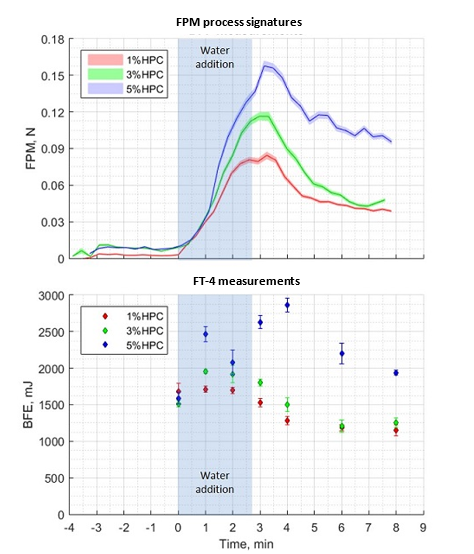
LIR technology was compared to BFE measurements by FT-4 in a case study that is reported in full in JPS, see also our White Paper 12 and Chapter 19 in Handbook of Pharmaceutical Wet Granulation. In this study, batches of three placebo pharmaceutical formulations containing different levels of binder (hydroxypropyl cellulose – HPC) were processed in a 10 L high-shear wet granulator.
The inline FPM data clearly shows the change in consistency of the granulating mass as water is added and the granulation proceeds. Water addition triggers an increase in FPM which peaks soon after the completion of this step. The FPM peak can be associated with the endpoint of the granulation. In-line and at-line data for all three formulations are summarized in figure and show closely similar trends. Clear differences are observed in the behavior of the three different formulations with the results indicating that higher binder contents are associated with the production of stronger granules.
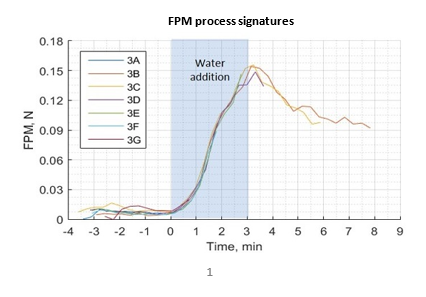
FPM signatures demonstrated excellent repeatability in monitoring HSWG
The figure shows seven FPM signatures for granulation of the 5% HPC formulation. Seven profiles were generated because the granulation was stopped at predetermined times to permit sampling and at-line measurement with a powder rheometer. Once a granulation had been stopped, a new granulation batch was loaded with the same formulation to produce samples for later time points. The seven traces correspond to the dry powder blend (profile 3A, negative time), and granulations stopped 1, 2, 4, 6, and 8 min (profiles 3B to 3G) after the start of water addition. Superimposition of the data for each batch confirms the high reproducibility of the inline LIR measurement.